Live Sandbox Graph Tour
Live Sandbox Graph Tour
Classification: Synthetic demonstration — no real participant data.
This tour pairs five conceptual diagrams with implementation views derived from the validated PIA-Sandbox and OSI-Sandbox projections. The implementation views use the exact synthetic labels and relationship vocabulary exercised by the assurance scripts; they are deliberately small, reusable graph views rather than database screenshots.
The tour includes both sides of the system: PIA shows how reviewed evidence is bounded into a capability representation, while OSI shows how source-grounded evidence becomes an organizational observation. Scroll down to the PIA live sandbox walkthrough and Live OSI sandbox walkthrough sections to see the actual graph and path-table images from those validated runs.
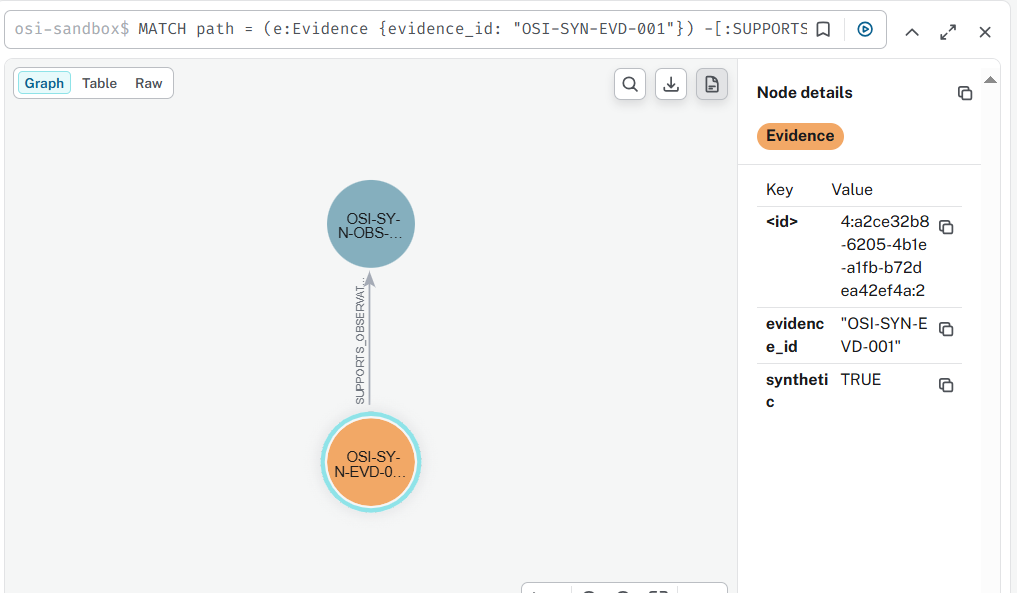
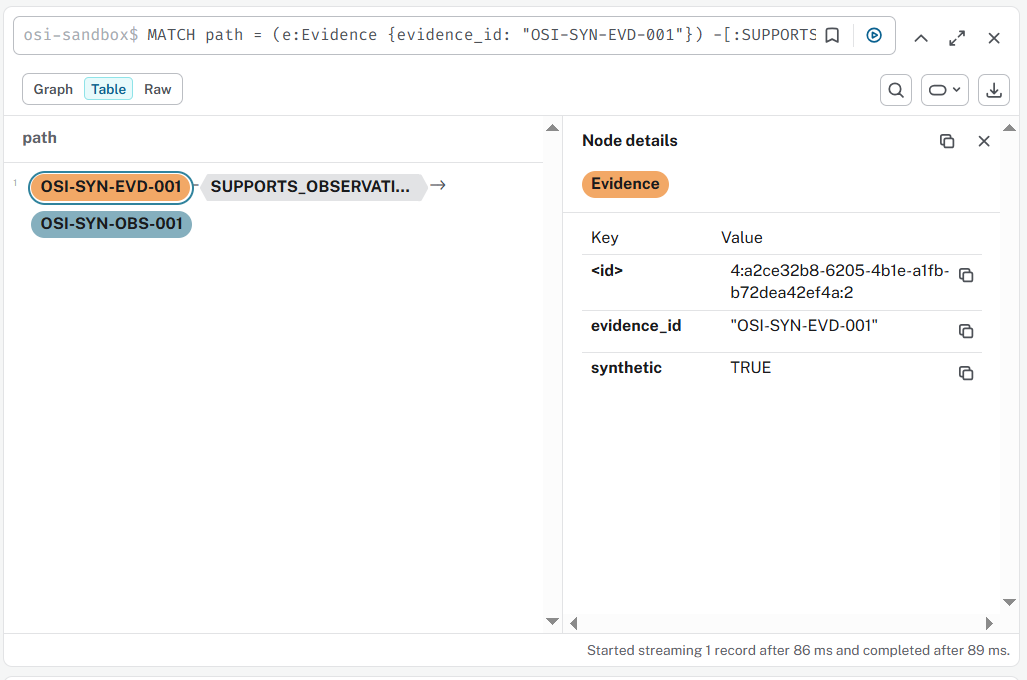
Later in this page, the Live OSI sandbox walkthrough section shows the actual Neo4j graph view and matching path table from a validated synthetic run. Those images let you compare the conceptual diagrams with the implementation and inspect the exact relationships directly.
Each pair answers a bounded question:
Live graph evidence preview
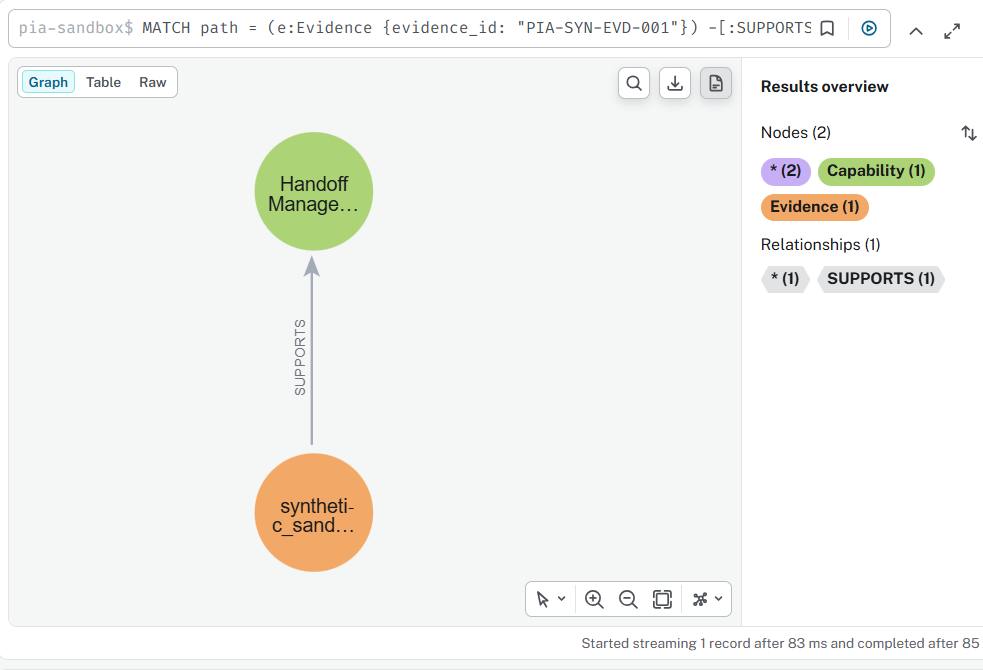
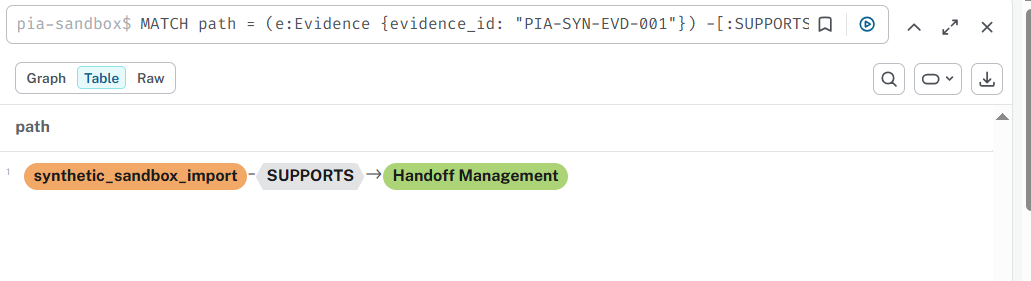
The two live pairs below are the actual Neo4j captures from the validated synthetic runs. The PIA pair shows an evidence-to-capability mapping; the OSI pair shows an evidence-to-observation mapping. Detailed explanations continue below.
PIA — live sandbox
OSI — live sandbox
- Where did a PIA representation come from?
- Why is existing capability not producing results?
- Which structural relationship creates a dependency bottleneck?
- What changed, and how did the effects propagate?
- How can individual and organizational knowledge relate without collapsing their boundaries?
1. PIA evidence chain
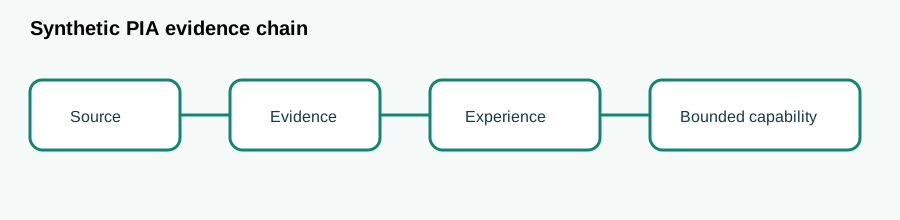
Conceptual model
flowchart LR
  P["Synthetic Participant"] --> S["Source Document"]
  S --> E["Evidence"]
  E --> X["Experience / Credential"]
  X --> C["Bounded Capability"]
Implemented graph view
flowchart LR
  E["Evidence\nPIA-SYN-EVD-001"]
  C["Capability\nCAP-PIA-HANDOFF-MANAGEMENT"]
  E -->|SUPPORTS\nPIA-SYN-MAP-001 · confidence 0.70| C
The validated sandbox projection proves the exact Evidence -[SUPPORTS]->
Capability assertion. Source provenance remains in the protected intake
record and is not exposed in this public-safe view.
What this demonstrates
PIA can project a reviewed, bounded interpretation into a graph without turning a résumé claim or opaque score into an unsupported fact.
2. Capability blockage
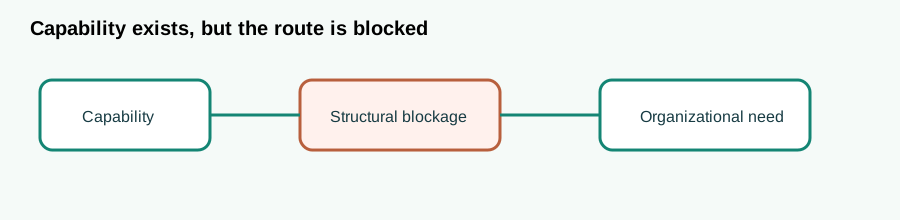
Conceptual model
flowchart LR
  P["Person"] -->|HAS_CAPABILITY| C["Capability"]
  C -->|REQUIRED_BY| N["Organizational Need"]
  C -.->|blocked route| R["Usable route"]
  B["Structural blockage"] -.-> R
Implemented graph view
flowchart LR
  O["Organization\nOSI-SYN-ORG-001"] -->|HAS_SOURCE| S["Source\nOSI-SYN-SRC-001"]
  S -->|CONTAINS_EVIDENCE| E["Evidence\nOSI-SYN-EVD-001"]
  E -->|SUPPORTS_OBSERVATION| Q["Observation\nOSI-SYN-OBS-001"]
  Q -.-> B["Condition requiring review\nnot a capability verdict"]
The OSI sandbox uses Organization → Source → Evidence → ObservationCandidate
and the SUPPORTS_OBSERVATION relationship. It stores an observed condition;
it does not silently convert that condition into an individual deficiency.
What this demonstrates
OSI can preserve organizational conditions as distinct observations so that capability absence and capability blockage remain analytically separable.
3. Bridge/dependency bottleneck
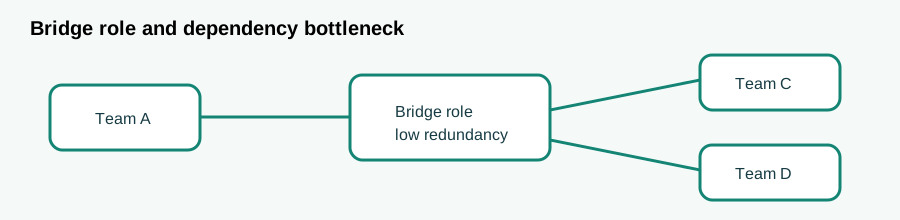
Conceptual model
flowchart LR
  A["Team A"] --> B["Bridge role"]
  B --> C["Team C"]
  B --> D["Team D"]
  B --> K["Tacit knowledge"]
Implemented graph view
flowchart LR
  O["OSI-SYN-ORG-001"] --> S1["OSI-SYN-SRC-001"]
  O --> S2["OSI-SYN-SRC-002"]
  O --> S3["OSI-SYN-SRC-003"]
  S1 --> E1["OSI-SYN-EVD-001"]
  S2 --> E2["OSI-SYN-EVD-002"]
  S3 --> E3["OSI-SYN-EVD-003"]
  E1 --> Q1["OSI-SYN-OBS-001"]
  E2 --> Q2["OSI-SYN-OBS-002"]
  E3 --> Q3["OSI-SYN-OBS-003"]
This is the three-path OSI synthetic structure validated for idempotence. The shared organization anchor and separate source/evidence/observation paths are the safe substrate for later dependency and vacancy analysis.
What this demonstrates
Topology can be inspected as a set of traceable paths rather than as a score; loss of a shared routing or knowledge relationship can therefore be tested as a state change.
4. State transition
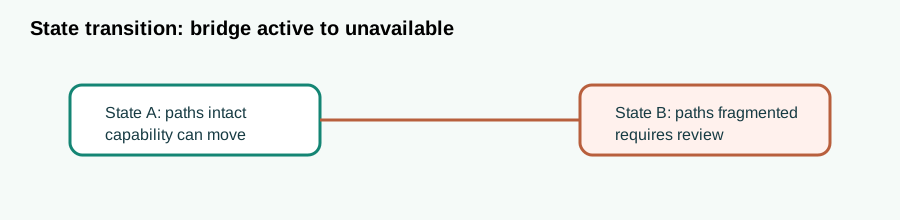
Conceptual model
flowchart LR
  A["Bridge active\npaths intact"] -->|vacancy / access loss| B["Bridge unavailable\npaths fragmented"]
Implemented graph view
flowchart LR
  R1["OSI-Sandbox run\n3 paths"] -->|state transition under test| R2["projected comparison\n0 or fewer paths"]
  R1 -.-> I["Idempotent baseline\nno duplicate relationships"]
  R2 -.-> G["Governed observation\nrequires review"]
The implementation view intentionally labels the transition as a test, not as a claim already stored in the graph. The assurance result establishes a repeatable baseline from which a vacancy/confound experiment can be compared.
What this demonstrates
OSI is designed to compare graph states and propagation effects, not merely to describe a static collection of nodes.
5. Governed cross-domain mapping
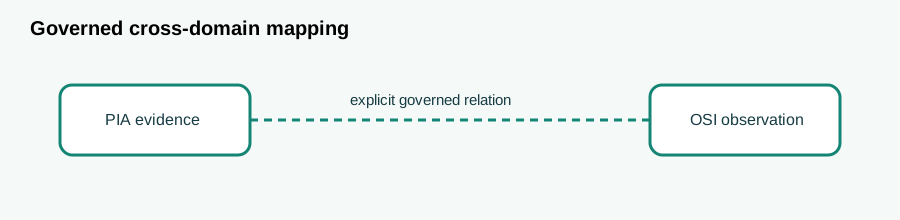
Conceptual model
flowchart LR
  PE["PIA evidence"] --> PC["PIA capability"]
  OE["OSI observation"] --> OC["OSI condition"]
  PC -.->|governed relation| OC
Implemented graph view
flowchart LR
  PE["PIA-SYN-EVD-001\nEvidence"] -->|SUPPORTS| PC["CAP-PIA-HANDOFF-MANAGEMENT\nCapability"]
  OE["OSI-SYN-EVD-001\nEvidence"] -->|SUPPORTS_OBSERVATION| OC["OSI-SYN-OBS-001\nObservationCandidate"]
  PC -.->|cross-domain mapping\nreviewed separately| OC
The dotted edge is a conceptual handoff, not an assertion written by either synthetic importer. PIA and OSI retain their own node types, identifiers, assurance rules, and review boundaries.
What this demonstrates
The architectures can relate individual capability evidence to organizational conditions without collapsing the PIA and OSI ontologies into one undifferentiated claim.
Assurance and publication placement
This tour is indexed under both Evidence and Publication Assurance. It is:
- synthetic and participant-safe;
- editable Mermaid source;
- reusable for later rendering or live-query capture;
- bounded to validated sandbox labels and relationships; and
- reviewed before publication.
The corresponding assurance records are the PIA and OSI sandbox projection
milestones in docs/history/. The canonical live captures are shown once near
the top of this page; older capture files remain in the image directory for
historical reproducibility but are not repeated here.